
Oracle Corporation
ORCL NYSE Earnings in 22 daysThere isn't enough steady cash-flow history to value Oracle Corporation yet. Its growth outlook scores strong; the balance sheet is solid.
After the OpenAI contract funding confirmation: analyst targets span ~$110–400 a share.
On consensus ORCL is the cheapest of its peers, at ~9.2x next year's earnings. Otto can't build a cash-flow range for this one yet, so the range shown is the analysts' own; the price, $101, sits below it.
01 · Forward P/E
- ORCL ~9.2x
- MSFT ~20x
- PLTR ~62x
- S ~48x
Next fiscal year's consensus earnings. P/E ÷ growth: ORCL ~0.12, peers ~0.76–0.78.
02 · Latest event
Oracle states its OpenAI contract is fully funded, addressing market financing scrutiny.
Headline: Oracle says OpenAI contract is fully funded, addresses market financing scrutiny — Investing.com
03 · The range, a share
- Analyst targets ~$110–400
Current price $101.
- ~9.2x
- Forward P/E, consensus
- ~0.12
- P/E per point of EPS growth
- $101
- Price: below the target range
- ~$110–400
- Analyst target range
Forward P/E and analyst targets: Yahoo Finance consensus. No cash-flow range: the company's reported cash flows don't support one yet. The event and its direction were read by AI from the linked headline; it supplies no figures. Not investment advice — Otto just crunches numbers.
At a glance
tap a tile to dig inOtto's verdict
the tiles above, in a line each- Health 13 of 18 health checks pass.
- Growth Revenue trend ≈ +7%/yr (extended trend, not a forecast).
- Street Analysts lean strong buy · avg target +133% from here.
- Dividend Pays a dividend — yields 1.98%.
Not investment advice — Otto just crunches numbers.
Price trend
-51.7% over one year · S&P 500 +5.7%
What think
The market's move: -51.7% over the past year
Trading 1% up its 52-week range. Price is the market's live vote — not advice.
Analyst consensus: Strong Buy · 40 analysts
Average 12-month target $236.18 — +133.4% vs today.
Yahoo Finance's analyst aggregate. Sentiment, not advice.
Insiders: 0 buys · 0 sales in recent filings
Open-market trades from SEC Form 4. Sales are often pre-planned (10b5-1); buys tend to say more. Sentiment, not advice.
InvestRight readers: 1 watching
This site's own activity — not a broad measure. Sentiment, not advice.
The snowflake
checks passed on each axis- Value 0/— checks
- Future 3/4 checks
- Past 4/4 checks
- Health 3/4 checks
- Dividend 3/6 checks
What does this show?
Five quick health scores — Value, Future, Past, Health and Dividend — each 0–100%. A bigger, more even shape means a stock that scores well across the board; a spiky one is strong on some axes and weak on others.
Learn more on Investopedia →Fair value
our estimate · not analyst forecastNot enough steady cash-flow history to estimate a fair value for ORCL yet.
What does this show?
Our estimate of what one share is worth based on the cash the business is expected to generate (a discounted-cash-flow model), next to today's price. Below fair value hints undervalued, above hints expensive — it's an estimate, not a guarantee.
Learn more on Investopedia →Health checks
18 checks run on free data- ⚠ Debt is under 40% of equity debt/equity 252%
- ⚠ Dividend covered by earnings and cash flow not fully covered
- ⚠ No dividend cut in recent years a cut shows in the record
- ⚠ Earnings growth beats the market 6.8%/yr vs market ~9.0%
- ⚠ Yield in the top quartile of payers yield 1.98% vs 2.34% cut among the 101 payers Otto tracks
- ✓ Debt well covered by cash flow operating cash flow covers 444.0% of debt
Show all 18 checks by axis
Value 0/— passed
- – Trading below our fair-value estimate
- – P/B below industry industry P/B not on the free feed
- – P/E below industry industry P/E not on the free feed
- – P/E below peer average peer P/Es land after the next refresh
- – P/S sane vs its own history needs multi-year P/S (Tier B)
- – More than 20% below fair value
Future 3/4 passed
- ✓ Earnings trending up 6.8%/yr over 9yr
- – Growth beats the industry industry growth not on the free feed
- ⚠ Earnings growth beats the market 6.8%/yr vs market ~9.0%
- ✓ Revenue trending up 6.6%/yr over 9yr
- ✓ Return on equity improving ROE 40.2% vs 17.5% 9yr ago
Past 4/4 passed
- ✓ Earnings grew over the period 9.5B → 17.1B
- – High-quality earnings (few one-offs) one-off detection deferred — needs statement detail
- ✓ Growth accelerating vs its average latest 37.3%/yr vs 6.8% average
- ✓ Revenue higher than five years ago 37.8B → 67.4B
- ✓ Return on equity above 20% ROE 41.2%
Health 3/4 passed
- – Debt/equity falling over time n/a
- ⚠ Debt is under 40% of equity debt/equity 252%
- ✓ Debt well covered by cash flow operating cash flow covers 444.0% of debt
- ✓ Interest comfortably covered by profit EBIT covers interest 4.5×
- – Short-term assets cover long-term debt n/a
- ✓ Short-term assets cover short-term bills 46.6B vs 41.8B
Dividend 3/6 passed
- ⚠ Dividend covered by earnings and cash flow not fully covered
- ✓ Dividend growing over time over 10yr on record
- ⚠ No dividend cut in recent years a cut shows in the record
- ✓ Payout ratio under 75% payout 31.4% of earnings
- ✓ Yield beats the market yield 1.98% vs market ~1.5%
- ⚠ Yield in the top quartile of payers yield 1.98% vs 2.34% cut among the 101 payers Otto tracks
What does this show?
Pass/fail rules on the company's finances — debt levels, profitability, cash cover and so on. More greens means a sturdier balance sheet; an n/a just means we didn't have that data point.
Learn more on Investopedia →Past performance
10-yr history from SEC EDGAR filingsRevenue
Earnings
Free cash flow
dashed line = what it'd look like growing at our ~9% market-average benchmark, for comparison
What does this show?
How revenue, earnings and free cash flow have grown over the years. Bars rising left-to-right show a growing business; the dashed line is a market-average pace for comparison.
Learn more on Investopedia →Revenue & expenses
FY 2026What does this show?
How a company turns sales into profit. Revenue splits into the direct cost of sales and the gross profit left over; from that gross profit come operating costs (R&D, SG&A), tax and interest — what survives is net income. Every figure is also shown as a share of revenue, so you can compare periods and companies of different sizes.
Learn more on Investopedia →Future
trend, not analyst forecastRevenue · extended at 6.6%/yr
Earnings · extended at 6.8%/yr
Dashed bars just extend the historical trend (capped at ±15%/yr) — the same growth our DCF uses. It's arithmetic on the past, not an analyst forecast; real futures bend.
What does this show?
Solid bars are history; dashed bars simply extend the past growth trend a few years forward — capped so it stays sane. It's a trend line, not an analyst forecast.
Learn more on Investopedia →Dividend
from cash actually paid, not promisesTotal dividends paid · split-proof, unlike per-share history
What does this show?
The share of profit paid back to shareholders as cash. Yield is that cash as a % of the price; the payout gauge shows how much of earnings is paid out (over ~75% can be hard to sustain).
Learn more on Investopedia →Ownership & insiders
from SEC Form 4 filingsNo open-market buys or sells in the recent filings — what's below is mostly awards and option activity.
- Exercise Rusckowski Stephen H · Director 793 sh 2026-11-18
- Exercise Smith Maria · EVP, Chief Accounting Officer 8,926 sh 2026-10-23
- Tax-withhold Smith Maria · EVP, Chief Accounting Officer 4,673 sh · $586,648 2026-10-23
- Exercise Henley Jeffrey · Vice Chairman 8,033 sh 2026-10-23
- Tax-withhold Henley Jeffrey · Vice Chairman 3,529 sh · $443,031 2026-10-23
- Exercise Catz Safra · Chief Executive Officer 8,033 sh 2026-10-23
- Tax-withhold Catz Safra · Chief Executive Officer 2,550 sh · $320,127 2026-10-23
- Exercise Levey Stuart · EVP, Chief Legal Officer 12,497 sh 2026-10-23
- Tax-withhold Levey Stuart · EVP, Chief Legal Officer 6,130 sh · $769,560 2026-10-23
Insiders must report within two business days. Sales are often pre-planned (10b5-1) rather than a signal — buys tend to say more.
What does this show?
Buys and sells by the company's own directors and officers, from their SEC filings. Insiders sell for many reasons, but clusters of open-market buying can signal confidence.
Learn more on Investopedia →Spot a missing competitor? Sign in to add it — it'll show for everyone.
What does this show?
A few peers in the same business, each with its own mini snowflake, so you can see how this company stacks up rather than judging it in isolation. Anyone signed in can add a missing competitor — it shows for everyone, marked as user-added.
Learn more on Investopedia →Leadership
Yahoo Finance · photos & bios via Wikidata-
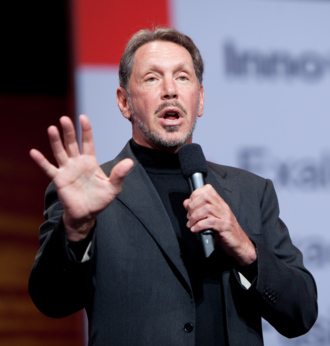
Mr. Lawrence J. Ellison
Co-Founder, Executive Chairman & CTO
American internet entrepreneur and businessman (born 1944)
- Age
- 81
- Total yearly comp
- $13.24M
- Education
- University of Illinois Urbana-Champaign, University of Chicago, South Shore High School
-
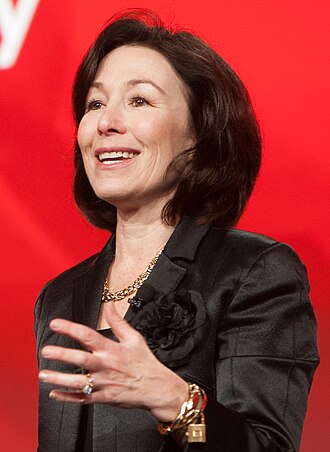
Ms. Safra Ada Catz
Executive Vice Chair
Israeli-American business executive
- Age
- 63
- Total yearly comp
- $1.29M
- Education
- University of Pennsylvania Carey Law School, The Wharton School, Brookline High School, Harvard Law School
-
Mr. Jeffrey O. Henley
Executive Vice Chairman of the Board
American businessman
- Age
- 80
- Total yearly comp
- $658,717
- Education
- University of California, Los Angeles, University of California, Santa Barbara
-
Mr. Michael D. Sicilia
Chief Executive Officer & Director
- Age
- 54
- Total yearly comp
- $7.94M
-
Mr. Clayton M. Magouyrk
Chief Executive Officer & Director
- Age
- 39
- Total yearly comp
- $5.80M
-
Ms. Hilary Barbara Maxson B.Sc., M.B.A.
Chief Financial Officer
- Age
- 47
- Total yearly comp
- $1.39M
-
Mr. Stuart A. Levey
Executive VP & Chief Legal Officer
- Age
- 61
- Total yearly comp
- $1.72M
-
Ms. Maria Smith
Executive VP & Chief Accounting Officer
- Age
- 59
- Total yearly comp
- $639,362
-
Mr. Douglas A. Kehring
Executive VP & Head of Operations
- Age
- 52
- Total yearly comp
- $1.31M
Ranked by title — reporting lines aren't public data. Compensation is the total Yahoo reports; blank means it isn't disclosed there.
In the news
- Oracle (ORCL) Hospital Java Patching Rush Meets New AI Product Push
- Oracle Stock Is Now Down Almost 70% From its Peak
- H-E-B, Southwest, Dell lead Forbes' best Texas companies list
- $1 Million In Cash: Buy Stocks Now Or Wait?
- Dell Stock Before Nov 24: Can A $95 Billion Backlog Still Make Money?
- Bloom Energy Sinks 26% in a Week, Vertiv Down 18%, as Nvidia’s Turmoil Hits AI Power Stocks. Time to Buy?
- Oracle says OpenAI contract is fully funded, addresses market financing scrutiny
- Credo Technology Group vs. Western Digital: Which Technology Stock Is a Better Buy for 2027?
My notes
Sign in to keep a private decision journal on this stock — only you can see your notes.
Hi! I can explain Oracle's numbers — valuation, health, the dividend, the fair-value gap. What would you like to know?
Otto explains what's on this page — not investment advice.